
Looker Studio Dashboards That Actually Drive Service-Business Decisions
Most service businesses I work with have GA4 installed, Google Ads running, maybe a CallRail subscription, possibly a CRM. The data is being collected. The data is rarely being looked at. And when it is looked at, it’s looked at across four browser tabs at once — GA4 in one, Google Ads in another, Search Console in a third, the CRM in a fourth — with the owner trying to mentally cross-reference numbers that don’t naturally cross-reference.
That’s the problem Looker Studio solves. One dashboard, all the data sources, with calculated fields that compute the metrics you care about (cost per lead, ROAS by channel, lifetime value to acquisition cost ratio) instead of the platform-default metrics. This post walks through what a service-business Looker Studio dashboard should contain, the calculated fields that pull weight, the common implementation mistakes, and where the line is between “useful dashboard” and “expensive complexity.”
What Looker Studio is
Looker Studio (formerly Google Data Studio) is a free reporting tool from Google that connects to dozens of data sources — GA4, Google Ads, Search Console, Google Sheets, BigQuery, Meta Ads (via paid connectors), and many more — and lets you build interactive dashboards in a drag-and-drop interface. It connects to more than 800 data sources via native and third-party connectors, allowing you to build interactive dashboards that bring everything together.
The free version covers what 95% of service businesses need. The paid Pro version (per-user licensing) adds team collaboration features, scheduled email delivery for static reports, and some advanced governance — useful for agencies but not necessary for a single business.
What Looker Studio is not: a substitute for clean data. If your GA4 has broken event tracking, if your Google Ads campaigns lack conversion goals, if your CRM doesn’t get updated regularly — Looker Studio will faithfully visualize the broken data without telling you it’s broken. Dashboards reward clean inputs and punish messy ones.
The three questions a service-business dashboard should answer
Before opening Looker Studio, write down the three questions you want a dashboard to answer at-a-glance. For most service businesses, they are:
- Where did leads come from this month? Channel breakdown — Google Ads, organic search, direct, referral, social, etc.
- What did each channel cost per lead? Total spend by channel divided by leads from that channel. The blended cost-per-lead number is useful; the per-channel number is essential.
- Which leads became customers? If the CRM tracks won deals or completed jobs, this is where you connect lead source to revenue. The hardest question to answer technically, but the most valuable.
The dashboard’s first page should answer these three questions in roughly that order. Anything that doesn’t directly serve one of those answers belongs on a secondary page or doesn’t belong at all.
The calculated fields that earn their place
Calculated fields are where Looker Studio shifts from “platform reporting” to “business reporting.” Built-in metrics from GA4 and Google Ads are platform-shaped — sessions, clicks, impressions. The metrics you care about — cost per lead, ROAS, LTV-to-CAC ratio — almost always require calculated fields built from multiple sources.
The calculated fields worth building for most service businesses:
- Cost per lead by channel — Total channel spend / Total channel leads. Requires blending Google Ads cost data with GA4 conversion counts. The single most useful number on the dashboard.
- Cost per acquired customer — Channel spend / Customers acquired. Requires the CRM data being available somehow (Google Sheets export is the easiest path).
- Lead-to-customer conversion rate by source — Customers / Leads, segmented by lead source. Reveals which channels produce qualified buyers vs. tire-kickers.
- Blended ROAS — (Revenue / Total marketing spend across all channels). The KPI most owners want to see.
- Cost per engaged session — Spend / Engaged sessions. A useful quality-of-traffic metric — surfaces ad campaigns that produce clicks but no real engagement. Catches waste before it’s catastrophic.
Each of these calculated fields requires the underlying data to be clean. Cost per lead requires both spend data and conversion data flowing in correctly. Cost per acquired customer requires the CRM data getting into Looker Studio (usually via Google Sheets, sometimes via direct connector if the CRM supports one).
The dashboard structure that scales
The pattern that consistently works for service businesses:
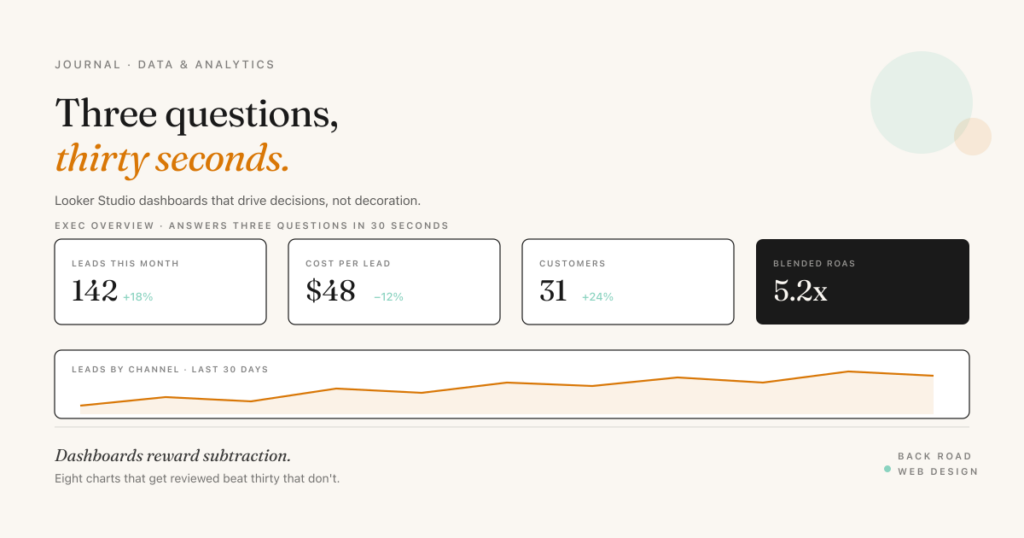
- Page 1 — Executive Overview. Six to eight scorecards (this month’s leads, this month’s customers, this month’s spend, blended cost per lead, blended ROAS, lead-to-customer rate). One time-series chart showing leads-over-time. One channel-breakdown table. That’s it. The page should be readable in 30 seconds.
- Page 2 — Channel Detail. Per-channel breakdowns. Google Ads campaigns, organic search top pages, top referral sources. Allows drill-down without cluttering page 1.
- Page 3 — Lead Quality. If you have CRM data flowing in — won-deal rate by source, average deal value by source, sales cycle length by source. Answers “are we getting the right leads or the wrong leads.”
- Page 4 — Trends. Year-over-year comparisons, seasonal patterns, anomaly detection. Useful but not daily-essential.
More pages than that and the dashboard becomes a thing nobody opens. The exec page does 80% of the work; the deeper pages exist for when something on the exec page raises a question.
Common implementation mistakes
Connecting before defining KPIs
The most common mistake: connecting GA4 and Google Ads first, then trying to figure out what to measure. The result is a dashboard full of platform-default charts that don’t answer business questions. The right order is the other way around — define the three questions you want answered, then build the dashboard backwards from those.
Trusting platform-default conversion counts
GA4’s default conversion tracking misses things. If you haven’t explicitly configured key events for phone clicks, form submissions, and chat starts, GA4 is reporting page views and engaged sessions but missing the actual lead actions. The dashboard built on top of incomplete tracking shows clean charts of meaningless numbers.
The fix is to pause the dashboard work and verify GA4 is tracking what matters first. The GA4 conversion tracking playbook covers the specific events and key event setup that service businesses need.
Trying to cross-reference attribution that doesn’t match
Google Ads reports attribution one way (last-click by default, with options for data-driven). GA4 reports attribution differently. Meta Ads reports its own attribution. Putting all three on the same chart and assuming the numbers add up to your real total is a structural mistake — the platforms double-count overlapping conversions.
The fix is to use one source of truth for actual conversion totals (usually GA4 for digital, plus the CRM for verified customer-becoming events) and treat each ad platform’s reporting as platform-specific quality data, not as the conversion source of truth.
Adding too many charts
The temptation when learning Looker Studio is to add charts because the tool makes it easy. The discipline is to subtract charts because the goal is fast comprehension. A 30-chart dashboard that nobody opens is worse than an 8-chart dashboard that gets reviewed weekly.
What the dashboard should drive (besides reporting)
A dashboard that’s only used for reporting is underused. The same dashboard should drive operating decisions:
- Monthly budget reallocation. If channel A’s cost per lead is half of channel B’s, the budget shifts. The dashboard makes this visible without spreadsheet work.
- Campaign pause/promote decisions. Specific Google Ads campaigns that consistently underperform get paused; ones that consistently outperform get scaled. The dashboard tells you which is which.
- Hiring decisions. If lead volume is sustainable above a certain threshold for three consecutive months, that justifies adding capacity. The dashboard shows the trend before the gut feel does.
- Retention campaigns. If lead-to-customer rate is dropping, the issue is qualification or sales process — not lead generation. The dashboard separates the two.
If the dashboard isn’t driving any of those four kinds of decisions, it’s decoration, not infrastructure.
Score your dashboard readiness
Looker Studio Readiness · 8 Items
Score your analytics setup.
Want help building a Looker Studio dashboard that drives decisions?
I’ll review your GA4 setup, ad platforms, and CRM, then design a dashboard structure with the calculated fields and visualizations that match how your business operates.
Get a free analytics audit →