
Every Q4 marketing review I sit in on has the same dynamic. The marketing team presents the year’s numbers. Leadership asks pointed questions. The numbers don’t answer the questions cleanly because the underlying measurement setup wasn’t built to answer them. The team scrambles to reconcile, the conversation drifts to “we’ll get back to you on that,” and the review ends without the budget conversation happening.
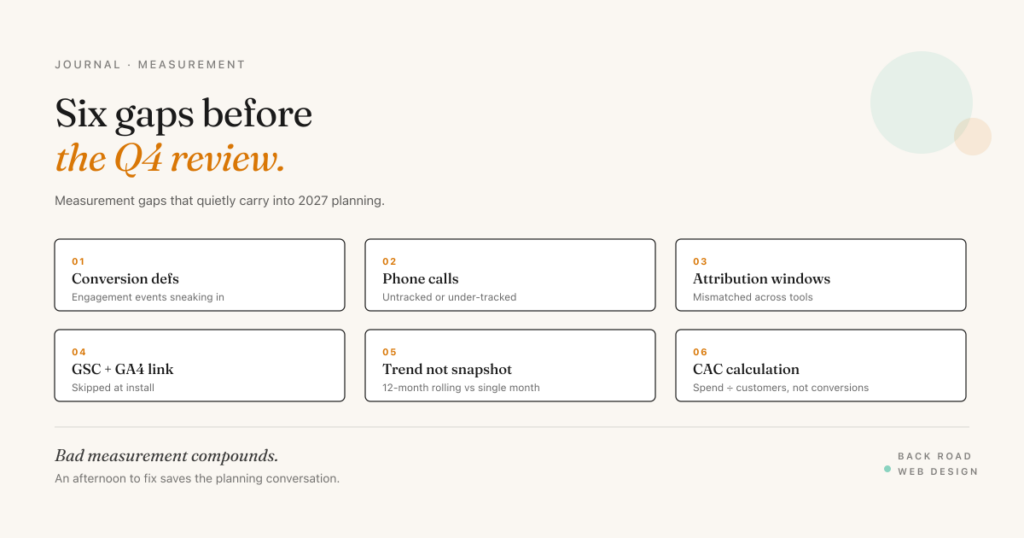
The fix isn’t a better presentation. The fix is closing the reporting gaps before the review. These are the six marketing reporting gaps I see most often, with the order I’d close them in.
Gap 1: Conversion definitions that include engagement events
GA4 lets you mark any event as a key event — what it used to call conversions. Most accounts set this up at install time and never revisit. By Q4 the key event list typically includes a mix of real conversions (form submissions, phone clicks, key page reaches) and engagement events that snuck in (page_view, scroll, view_item, generate_lead with no qualification).
The audit takes 10 minutes. Open GA4 → Admin → Data display → Events and look at which events have “Mark as key event” toggled on. Walk the list and ask one question per event: “if I told leadership we got 1,000 of these last quarter, would they think we got 1,000 customers?” If the answer is no, the event isn’t a conversion — it’s engagement. Toggle it off.
The version of this number you bring to the Q4 review should be the conversion volume that matches the business outcome. If your previous “1,247 conversions” includes 800 scroll events, the number leadership remembers from the review is wrong, and every comparison you draw against it later is wrong too.
Gap 2: Phone calls untracked or under-tracked
For local service businesses, the majority of conversions come by phone. Most GA4 setups track form submissions cleanly and ignore phone calls entirely — or track only the website “click to call” interaction, missing the calls customers make from looking up the phone number on the GBP profile or from Google Maps.
The minimum acceptable setup:
- Website-initiated calls tracked via GA4 click event on the phone-number link
- GBP-initiated calls tracked via Google Ads call extensions or a dedicated tracking number on the profile — Google retired GBP’s own call history in July 2024, so the profile itself only reports a count of call-button taps
- Paid-ad call extensions tracked as conversions in Google Ads, imported into GA4
If you’re running paid ads and you don’t have call-extension conversion tracking firing, your reported cost-per-conversion is inflated by however many calls those ads drove. For service businesses, that’s often a 30–60% under-count on the conversion side.
A better path is a dedicated call-tracking platform (CallRail, CallTrackingMetrics) with dynamic number insertion that swaps the displayed phone number based on traffic source. Setup takes a few hours, monthly cost is reasonable, and the conversion data becomes complete.
Gap 3: Attribution window mismatches across tools
GA4 defaults to a 30-day attribution window. Google Ads defaults to a 30-day window. Meta Ads defaults to a 7-day click, 1-day engage-through, and 1-day view window. Search Console reports last-touch only. Your CRM probably defaults to first-touch or last-touch depending on platform.
When you pull numbers from each tool to build the Q4 review, you’re comparing different attribution models and treating them as if they’re the same metric. Lead totals don’t match across tools, and the explanation isn’t “the numbers are wrong” — it’s “the attribution windows are different.”
The fix isn’t to force one window everywhere; it’s to know which window each report uses and call it out in the dashboard. A single “Attribution window” footer row in your monthly dashboard saves a recurring 15-minute discussion every review.
Gap 4: Search Console + GA4 not linked
GA4 has a built-in Search Console integration that brings organic-search query data into the GA4 acquisition reports. Most accounts skip the integration because it’s tucked in Admin and the setup looks intimidating. It isn’t — 5 minutes if you have admin access to both.
Without the link, your GA4 acquisition reports show “organic search” as a black box. With the link, you can see which queries drove the organic traffic, which pages received it, and how those queries converted. That data is the foundation of any Q4 organic-channel review.
Gap 5: Looker Studio (or whatever dashboard) shows trends, not snapshots
A Q4 review needs trend lines, not point-in-time snapshots. “We did 247 conversions in October” is a fact; “we did 247 conversions in October, up from 218 in September and 195 in August” is a story.
Most dashboards I see during Q4 reviews are built around the current month and a single year-over-year comparison. The view leadership needs:
- Last 6 months month-over-month trend (sessions, conversions, conversion rate, paid spend, paid conversions)
- Same trend split by traffic source (organic, paid search, paid social, direct, referral, email)
- A “what changed” annotations column where major changes (campaign launches, page redesigns, budget shifts) are noted on the timeline
Looker Studio handles all of this natively. The dashboard rebuild takes an afternoon if you already have a basic Looker setup, or a day if you’re starting from scratch. It’s the single highest-impact fix on this list for the Q4 review specifically.
Gap 6: Customer acquisition cost not calculated
The most expensive number missing from most Q4 reviews is customer acquisition cost. Marketing spend is reported. Conversions are reported. The two never get divided.
A clean CAC calculation needs:
- Total marketing spend (paid media + tooling + agency/operator costs + content investment) for the period
- Total new customers acquired (not leads, not conversions — actual new revenue-generating relationships) for the same period
- CAC = spend ÷ new customers
Most operators report CAC as “cost per conversion” which is a different number. Conversions are leads or signals; customers are revenue. A $100 cost per conversion at a 25% close rate is a $400 CAC. The difference matters when leadership is deciding whether to fund more of the same in 2027.
If the close rate isn’t reliably tracked, the CAC estimate is approximate. That’s still better than not estimating it at all.
Run the audit in one afternoon
The six gaps above are the recurring shape of the issue. Each individual gap takes 20 minutes to an hour to close. An afternoon block — say, a Friday in late October — closes all six on most accounts. Walk into the Q4 review with the gaps closed and the conversation becomes about the business, not about the measurement.
If you want a structured framework for the dashboard tab itself, I built a Monthly Marketing Scorecard — a Google Sheets template where five input tabs feed a single dashboard tab with trend lines, source split, and a “what changed” notes column. Ask for it when you book a free strategy audit and I’ll send it over. It’s built for the Q4 review and every monthly review after it.
Related reading: GA4 Conversion Tracking for Service Businesses · Looker Studio for Service Businesses · What Does a Customer Cost — Marketing ROI. Looking for hands-on help? See Data & Analytics.