
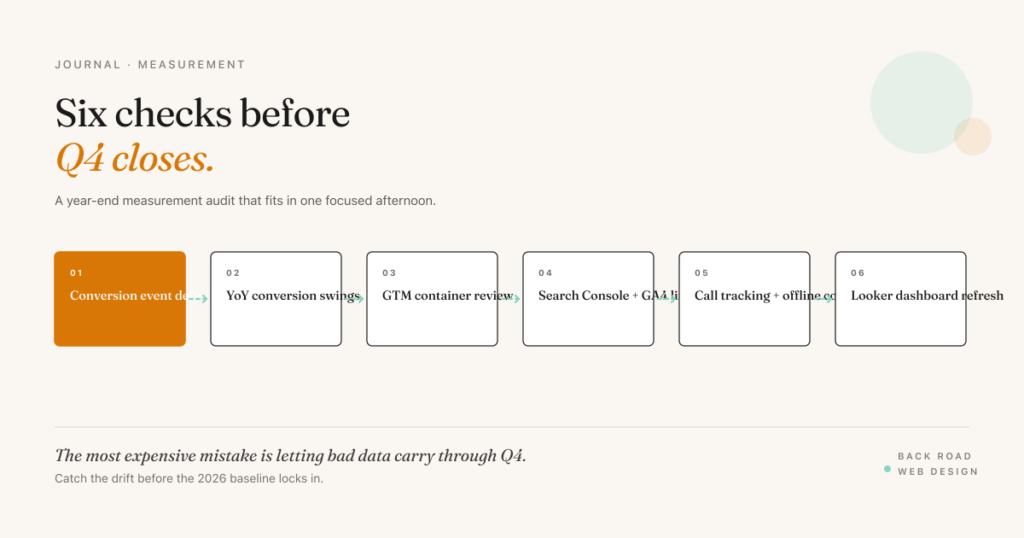
The single most expensive measurement mistake I see is letting bad data carry through Q4 into the year-over-year comparison for next year’s planning. If your GA4 conversion definitions were wrong all year, the 2026 baseline you use to plan 2027 is wrong, and every comparison you draw against it later compounds the error.
A focused year-end measurement audit closes that risk in one afternoon. Six checks, in the order I run them.
Check 1: Key event definitions
Open GA4 → Admin → Data display → Events. (GA4 renamed conversions to “key events” in 2024 — same concept, new name.) Walk every event with the key-event toggle on and decide: keep, fix, or remove.
The events that almost always should be key events:
- Form submissions (lead form, contact form, audit request)
- Phone-number clicks on mobile (the user dialed)
- “Click to email” (rare in service businesses; more common in B2B)
- Booking-page reaches with engagement (someone arrived on the booking flow and stayed)
The events that almost never should be key events:
page_view(every page load)scroll(everyone scrolls)view_item(browsing, not buying)generate_leadwithout a qualifying filter (default event fires too broadly)
If you have any of the “almost never” list active, your conversion totals through 2026 are inflated and the year-over-year math you use in 2027 is wrong. Fix this before Q4 closes so your 2026 baseline reflects real conversions.
Check 2: Conversion volume year-over-year
Pull GA4 → Reports → Engagement → Key events for 2026 full year vs 2025 full year (or 2026 YTD vs same-period 2025 if the year isn’t over). Note any individual event with a 30%+ swing in either direction.
A 30% swing usually means one of three things:
- The conversion definition changed mid-year (someone marked an event as a key event or unmarked it)
- The underlying user behavior actually changed (a campaign shift, a product change, a market shift)
- A tracking break happened and went unnoticed (most common, most painful)
Investigate every swing before locking the year-end report. The investigation often surfaces a fix that affects how the number gets presented in the 2027 planning conversation.
Check 3: Google Tag Manager container review
Open GTM → Tags. Walk the tag list looking for:
- Tags marked “Paused” that should be removed
- Duplicate tags firing the same event (GA4 + Universal Analytics holdouts, or accidentally cloned tags)
- Tags firing on All Pages that should be scoped to specific triggers
- Tags with no firing trigger at all (orphans from cleanup work that didn’t finish)
The cleanup matters because Q4 traffic is usually the highest-volume traffic of the year. Duplicate or over-firing tags inflate session counts and event counts. Clean container = clean Q4 numbers.
Check 4: Search Console linkage and query data
GA4 → Admin → Product links → Search Console links. Confirm the link is active and the property mapping is correct.
In Search Console itself, pull the last 12 months of queries and check:
- Total clicks and impressions trend (look for any month with an unexplained drop — that’s a tracking break or a Google Search Console reporting issue worth investigating)
- Top 20 query list — are these the queries you’d want to be ranking for?
- Click-through rate distribution across positions 1–10 — pages in position 3–5 with under-2% CTR usually have a title/meta description gap worth fixing
The Search Console data feeds the 2027 organic strategy. Clean data here drives better decisions on content investment.
Check 5: Call tracking and offline conversions
Two questions for any service business:
- Are phone calls tracked as key events in GA4 or conversions in Google Ads?
- Are offline conversions (someone who called and became a customer) imported back into Google Ads?
If the answer to either is no, the cost-per-conversion you’re reporting is inflated and the channels driving phone-call volume look under-performing in the data. For service businesses, this is the most common reason a paid channel looks like it’s losing money when it’s actually working.
Year-end is the right time to either set up call tracking properly (CallRail, CallTrackingMetrics) or build a manual offline-conversion import process for the highest-spend campaigns.
Check 6: Looker Studio dashboard refresh
Open your monthly dashboard. Check:
- Date ranges roll forward correctly (the dashboard should be showing November and December data, not stuck on Q3)
- All data sources are still connected (GA4, Google Ads, Search Console, Meta Ads, call tracking)
- Any “calculated field” formulas that may have broken when source schemas updated
- Year-over-year comparison views are configured for the right comparison period
If your dashboard is stale or broken, the year-end report you generate from it will be too. A 30-minute dashboard refresh saves a 3-hour scramble at the end of December.
The audit fits into one afternoon
Six checks, 30–60 minutes each on most accounts, often less. The full audit is a Friday afternoon in early November. The fixes that surface during the audit usually take another half-day to ship.
The discipline matters because next year’s planning conversation depends on the 2026 baseline being honest. Bad measurement compounds — a 30% inflation in conversion counts now means the 2027 budget request is sized to a fake baseline, and the gap between expected and actual results next year doesn’t surface until Q2 or Q3.
For a structured GA4 setup framework that complements this audit, I built a 47-step GA4 setup checklist from the setups I’ve shipped and audited. Ask for it when you request a free strategy audit and I’ll get you a copy.
Related reading: GA4 Conversion Tracking for Service Businesses · Looker Studio for Service Businesses · Why Isn’t My Website Ranking on Google. Looking for hands-on help? See Data & Analytics.